Case Study: Eskilstuna GUIF Handball Season 2012-2013
Written by Peter Glas
Background: Eskilstuna GUIF is a handball team playing in the highest league in Sweden (Elitserien). The team has been using Firstbeat Sports since season 2011-12 and has been searching for a tool to monitor the players’ recovery to determine strategies how to peak performance before each game to be as recovered as possible for the game.
During the season GUIF peaked their performance during Christmas and was #1 in the league before the national team break in January. In February and March the team suddenly lost 6 out of 8 games and we were curious why?
Question: How can Firstbeat Sports Quick Recovery Test be used to monitor the recovery trends/progress to help peak the players?
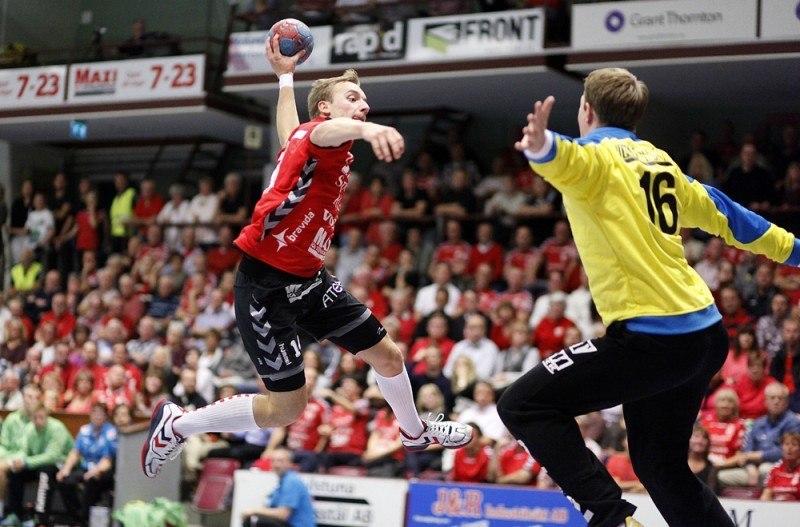
Performing the test: In GUIF before each practice the quick recovery test is performed: every player rests around 5 minutes on the ground on the playing field before warm-up. The players should lie down on their backs with their hands resting on the floor or at their waist and with their legs firmly planted on the floor, no bent knees allowed.

Interpreting the data: To determine the season as a whole, the QR values of the last practice before the game were exported from Sports and the team average QR Index was recorded. The game result was then compared to the QR Index with the ‘value’ of the game, V=Win, F= Lost, O=Draw. The trend line was obvious. When the team average was at a higher value before the game the chance of a win increased especially if the ‘trend’ of the team was increasing since the last game, QR average ‘arrow’ pointing up.
Conclusion: We detected a clear line between the QR team average and the result of the game, especially when comparing the QR trend line. If a higher value was detected with the trend line moving up an increased chance of win occurred.
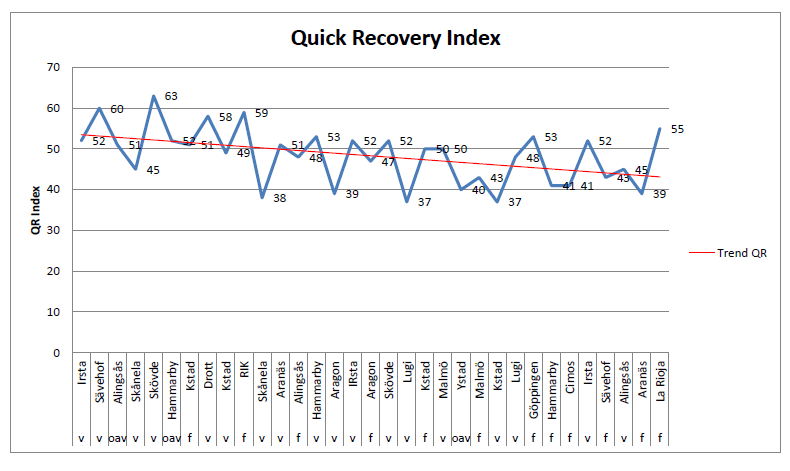
Future thoughts: Due to the amount of games, European Cup and League, the QR test was not performed as often from February till the end of the season. QR test was not recorded always before the last practice prior to game. This might produce some error in interpreting the index and the trendline.
For this season I’m focusing also on training load encouraged by the example from San Jose Sharks. We monitor TRIMP values of the two last practices before a game, try not to exceed 100 in team average (outfield players) and also combine that value with the QR Index of the last practice. By combining the information of training load and recovery we aim to determine even in more detailed way how to peak performance and avoid possible setbacks due to the lack of recovery or by pushing the players too hard before a game.
Peter Glas
Head strength and conditioning coach
GUIF Eskilstuna
If you liked this article, you should subscribe to our mailing list.
Give your team the Firstbeat Sports competitive advantage.
Contact us for more information or get a quote.
You might also be interested in
Real-time TRIMP/min: How to Use the Firstbeat Sports App Feature in Training
From replicating game intensity to aiding player rehab, monitoring TRIMP/min has wide-ranging benefits.
Why Monitor Internal Load in Elite Sports?
A look at the what, how and why of internal load monitoring and why it should form part of your training program.
How to Use Training Effect: The Firstbeat Sports Feature that Measures the Impact of Training
In this article, we look at how Training Effect is calculated, the Training Effect scale, and how it is visualized in Firstbeat Sports.
