I stayed clear of Covid-19 for two and a half years, with vaccinations, good luck, a healthy lifestyle, and common sense (masks, hand washing, and avoiding crowded places whenever I could). This summer we visited family in the US and somewhere during the return trip, I finally picked up the virus.
Despite a good starting point plus three vaccinations, I did not get by with a mild version. I was out of action for almost two weeks, and still clawing my way back to full strength. The biggest symptom was total exhaustion; I felt foggy and weak, with no energy to do anything. In addition, mild fever for a few days, a persistent upper respiratory infection, and a lost sense of smell.
But I know many have experienced the same or much worse. The reason I’m documenting my experience is to share some Firstbeat Life heart rate variability data that I collected during this period. Unfortunately, I was not measuring when I first got sick – with combined jetlag and Covid, I just wanted to sleep instead of being my own guinea pig. My Garmin showed an untypically high heart rate and steady “high stress”, and I could feel my heart beating fast. I have no doubt that my Firstbeat Life data would have been very “red”.
Measuring the Effect of Covid-19 on My Stress and Recovery Levels
Once the fever came down, but I continued to feel worn out and foggy, my curiosity took over and I put my Firstbeat monitor on to see how my body was coping. My main activity during this time was “being” (resting and sleeping), so these measurements were in no way representative of my normal lifestyle. This is well demonstrated in the trend view of my physical activity points (Fig. 1). My usual 60-100 points per day was replaced by 1 and 15 points! By day 11 of Covid, I was doing a few basic chores and moving around a bit, but this was clearly not a time to worry about exercise.
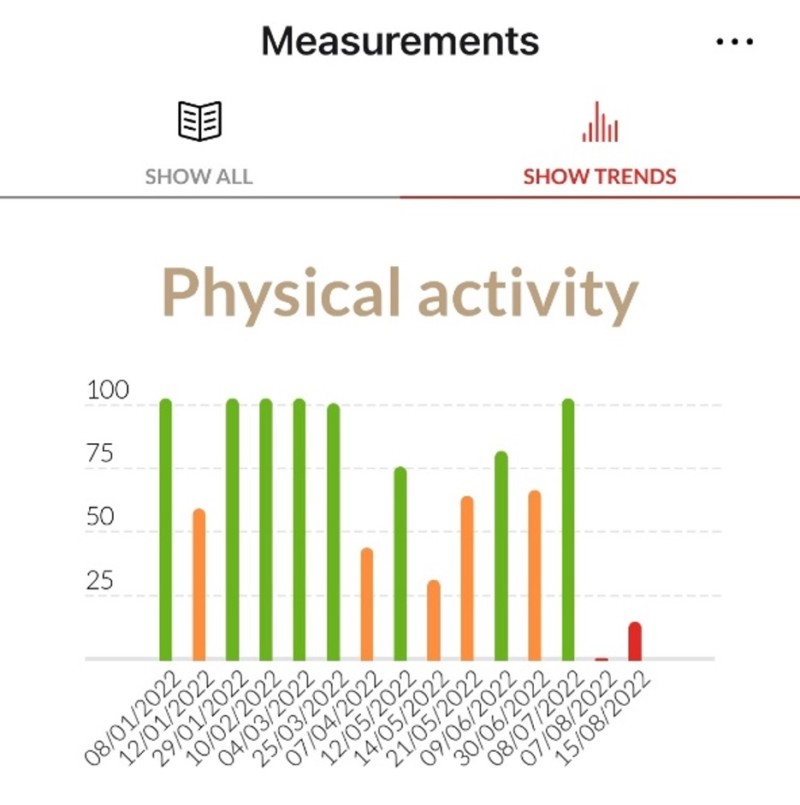
Fig. 1. The trend view of my daily physical activity demonstrates how little activity was recorded during my Covid days. One should not exercise when sick, but to have no energy to be even mildly active was a striking realization.
Reflection on My Results – Day 4 of Covid
I was feeling tired and unwell, with zero energy, but the fever was gone. I felt that I had slept ok, and my data supports this (Fig 2). The sleep score was a moderate 64/100 (average score for me). Resting HR was slightly higher / HRV slightly lower than my average.
It’s interesting to see so much daytime recovery, despite feeling so poorly. At first glance, the conclusion could be that things look great, with an excellent stress-recovery balance of 92/100. In reality, I was so “out of gas” that my body switched to a conservation mode instead of creating a stress response. Maybe this means that resting and watching TV was doing its job – my body was able to get physiological recovery… When you contrast the result to how I was feeling, it’s a reminder that the green color, recovery, has many possible explanations. It is a good sign that stress reactions were not dominant, but we cannot just conclude that a green graph means “all is well”.
Incidentally, a similar result can be seen with people who routinely spend their leisure time on the couch. They might show green days because they are not doing much, but this is not a reflection of a balanced lifestyle. We need to look at the context: what were they doing, how many steps did they take, etc.? Green is not good or bad in itself; it needs to be interpreted right. In my case, it gave me confidence that resting was the right thing to do and that my body was coping with the situation.
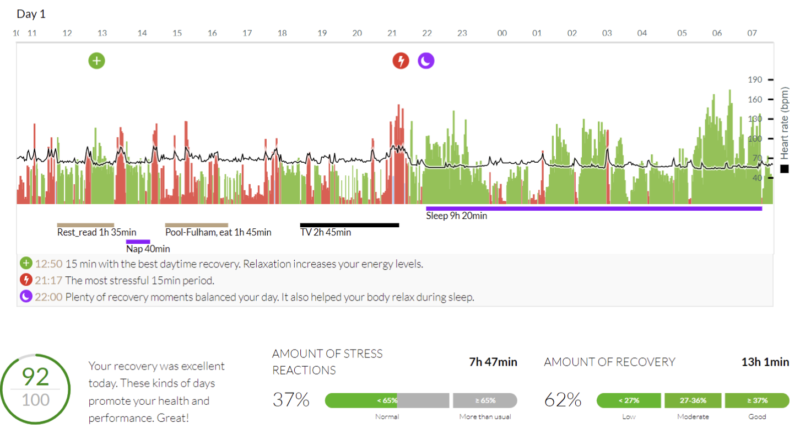
Fig. 1. Firstbeat Life graph from day 4 of Covid. The sleep score was 64/100 (long duration, but average HRV somewhat low) and the 24-hr stress-recovery balance a high 92/100.
Day 11 of Covid
I was now feeling better, starting to do a few light chores, and even shortly ventured to the woods by my house to pick blueberries. You can see these few active segments as light blue in the graph below, something that was completely missing from the first measurement. Otherwise, the Firstbeat Life graph now shows a more “normal” pattern, with more stress reactions during the day and less recovery. Being more active – simply doing something! – meant that my body was showing more stress reactions. Stress-recovery balance was 72 (instead of 92 the week before) because even light activity (easy chores and cooking) kicked up a big stress response (high red bars), suggesting that I still needed to take it easy. I was not worried about the increased red, though – to me it meant that I was on the road towards normal. The biggest sign that I was coping was my sleep data, which showed improved HRV (compared to the week before) and a good sleep score of 74/100.
My data is a good reminder that we should not take specific numbers in any data too literally, but also look behind the numbers when we make conclusions and consider what’s going on in our lives. Data can provide valuable insights and steer us in the right direction, but it cannot always tell if we are feeling well or not – for that, we also need common sense and good self-knowledge.
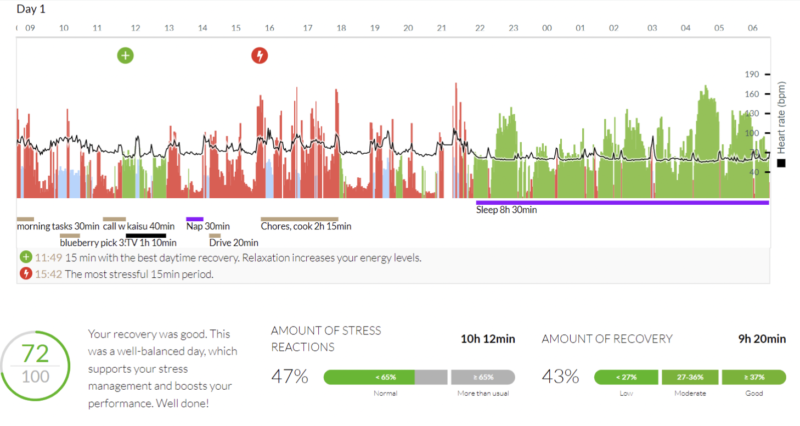
Fig. 2. Day 11 of Covid shows a better sleep result (74/100) but more daytime stress due to being more active, instead of just lying down. The stress-recovery balance is still a good 72/100.
Individual differences in this kind of data are huge, and I have seen very different Covid results from others, with stress all day and most of the night. Several elite athletes have reported significantly higher resting HR and lower resting HRV for weeks after being ill, having to scale their training way back, or even skip the competition season. To avoid further health problems after Covid-19 (such as myocarditis), medical professionals recommend slow progress to normal training, for athletes and regular people alike, especially when it comes to high-intensity exercise.
Data Learnings
Most of us have got or will get this pesky virus at some point, and we should continue to treat it with proper “respect”. You might be one of the lucky ones to get by with mild symptoms, but there are no guarantees. Let’s do our part and stay home when sick and give our bodies the chance to recover well before returning to full steam. And regarding wearable data, it can for sure provide interesting insights and help us navigate the recovery process, as long as we interpret it sensibly and remember to look at the context.
I look forward to hearing what your Firstbeat Life (or other) data shows – feel free to share it with me (tiina.hoffman@firstbeat.com) and perhaps I’ll share additional insights and experiences (anonymously) in a follow-up blog.
Firstbeat Life is the leading technology to support the health and well-being of your customers. It offers you a unique capability to succeed in the growing market for proactive health and well-being services. Learn more about Firstbeat Life.
If you liked this article, you should subscribe to our newsletter.
You might also be interested in

Notifications on Poor Recovery: Take a Proactive Approach to Your Health
Physiological data can reveal how your body is coping with everyday life. But how do you know when you need to address certain issues? Personalized notifications in the Firstbeat Life solution let you know when your measurement results need extra attention.

Firstbeat Life: How Do You Get Employees Engaged in Corporate Wellness?
When it comes to corporate wellness, one of the most common problems is getting employees engaged. So, what to do? Our specialist gives concrete tips, how to get employees commit to small changes.
Measuring Stress to Improve Wellness and Performance
Stress used to be a clear concept with vague implications. We’ve all felt it, and too much of it can harm our health. Still, many wonder what can be done….

