This section will help you take the important first step towards understanding, interpreting and utilizing some of the unique metrics that Firstbeat Sports offers. Master them and what they mean for the athlete.
1. Understanding EPOC
EPOC measures the quantity of exercise-induced disturbance of the body’s homeostasis, but what does this actually mean?
Exercise greatly increases the cellular demand for oxygen. EPOC is the phenomenon that arises when there is a lack of oxygen relative to the energy demands of the working tissues. This occurs as the anaerobic pathways are utilized until the aerobic pathway is able to cope with the body’s energy, and therefore oxygen, demands.
When we stop exercising the oxygen demands don’t instantly drop. We don’t instantaneously return to homeostasis. There are several processes that take place during recovery from exercise that still have greater oxygen demands than when we are at rest. These include:
- Restore oxygen in tissues (muscle)
- Restore heart rate and breathing rate
- Replenish muscular substrates (phosphocreatine and glycogen)
- Return body temperature to normal 98.6°F (37°C)
- Normalize hormonal circulation
- Muscle protein synthesis/repair
Looking at the below graph, we can see that the higher the EPOC achieved during activity, the greater the disturbance to homeostasis and, subsequently, the greater the recovery demands.
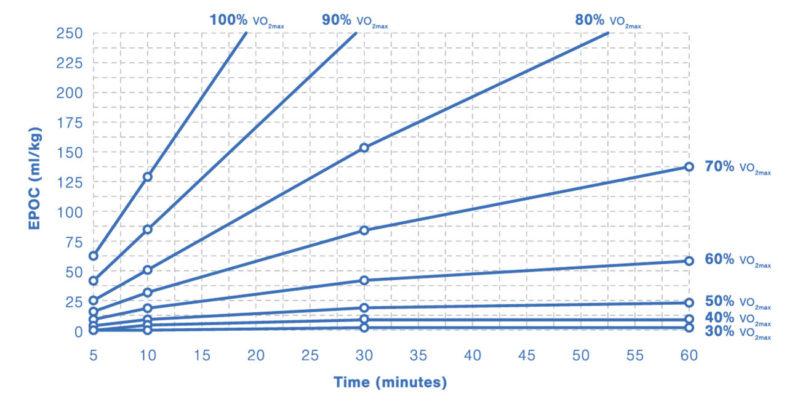
Figure 1. EPOC is predicted dynamically based on current exercise intensity (%VO2max) and time spent at that intensity. The crucial point of EPOC modeling is to accurately measure exercise intensity, which, in the Firstbeat model, is performed by neural networks utilizing heart rate, heart rate variability-derived respiration rate, and on/off-kinetics information describing the different physiological responses in changing exercise intensities. The model can predict the amount of EPOC at any given moment and no post-exercise measurement is needed.
EPOC is an excellent measure of how hard a training session has been. It doesn’t continue to accrue during lower intensity periods if the body is able to grab some brief recovery and only reflects those moments when the intensity is greater than can be coped with.
This contrasts with a metric like TRIMP, which (while extremely useful in certain contexts that will be covered elsewhere) will still accrue if the heart rate is above resting levels even if the body is beginning to recover.
See Figure 2 below for an example. EPOC is represented by the thin red line which peaks at a 148 reading. This is a very logical way to measure the load of a session.
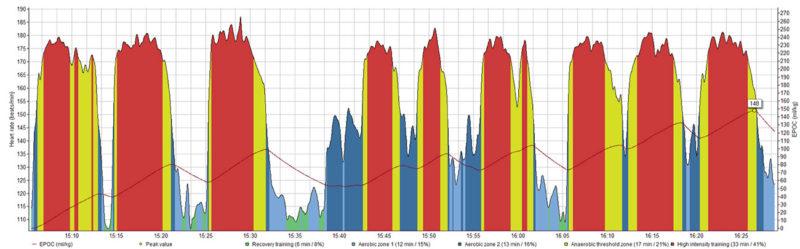
Figure 2. An example heart rate and EPOC trace from a rugby match.
Consider the graph again, if you extend the rest period between work periods the body has more time to recover between them. As a result, you reduce the overall disturbance in homeostasis.
Conversely, if you shorten the rest periods there is less opportunity for recovery and the overall demands of the session are greater, despite the total work still being the same. EPOC takes the context of the work into account, and not just the volume of work that has been completed.
For a more in-depth look at how we calculate EPOC you can read the relevant White Paper here
2. Training Effect
Training Effect (TE) is a 0-5 scalar score that tells you how big an effect a training session or game has had on an athlete’s fitness.
The scale is broadly broken down as follows:
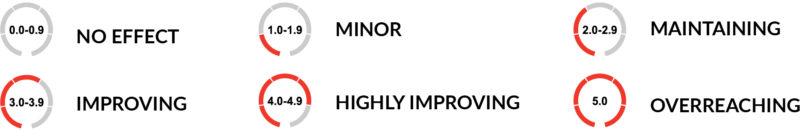
Figure 3. Threshold guidelines and what they mean when analyzing Training Effect.
It is important to have variety in the training you prescribe. Even if you are in a period where you don’t feel noticeable gains are possible you should not simply aim for sessions that fall between 2.0-2.9 TE. Furthermore, any session scoring 5.0 TE will not lead to immediate overreaching. You will probably have these scores occasionally and this is absolutely fine as long as appropriate rest and recovery are factored into the program.
This type of functional overreaching is an often-used strategy during conditioning periods such as a soccer pre-season. This is because competitive performance and results are temporarily of lower priority than improvements in physical fitness during these periods. However, regular scores of 5.0 TE without the appropriate rest will likely lead to an overreaching condition. If not remedied accordingly this could lead to overtraining.
Aerobic Training Effect
When using EPOC it is important to consider individual responses and what they mean. A less fit athlete will accumulate EPOC more quickly and have a higher internal load for a given amount of external work. A highly fit athlete will accumulate less EPOC for a given workload and will need to achieve a higher EPOC to have the same impact upon their fitness.
This inter-athlete variability is where Training Effect comes in.
Training Effect is a metric designed to normalize all the individual characteristics into a value that can be compared across athletes.
Aerobic Training Effect describes the impact of a session in terms of VO2max and endurance capabilities and is primarily based upon the peak EPOC recorded within a session. This use of the peak value is important because, as mentioned previously, while time and movement-related variables will accrue over the duration of a session this does not mean the body cannot have achieved some recovery after EPOC has peaked.
Although Training Effect normalizes the EPOC values into a number that can be compared across individuals it is still worth keeping in mind that an athlete and their training load needs to be considered on an individual basis. What is right for one athlete is not necessarily right for another. There will, however, be circumstances where it is necessary to make inter rather than intra-individual comparisons. This is particularly true in team sports.
Anaerobic Training Effect
Anaerobic Training Effect completes the picture in terms of energetic demands during a training session or game.
Whilst Aerobic Training Effect examines the impact on VO2max and endurance, Anaerobic Training Effect quantifies the impact upon repeated sprints and the highest intensity activities. This metric is extremely important for intermittent sports like soccer or ice hockey (among many others) where the demands are very stop-start (Bangsbo, Mohr & Krustrup, 2006; Bradley, et al., 2010) and cannot be quantified using heart rate alone.
The intensity of work performed during anaerobic periods such as sprinting can be as high as 150% of VO2max but intensity as a percentage of HRmax is limited to 100%. Heartbeat dynamics are utilized to assess Anaerobic Training Effects.
For example, a short sprint from a resting state will be almost completely anaerobic but this is unlikely to be reflected by the athlete’s heart rate reaching the highest HR Zone (“red-zone”) or similar and would be lost if only considering %HRMax. Conversely, it is possible to spend extended periods of time at a very high %HRMax (Åstrand, & Rodahl, 1986) as shown in figure 4.
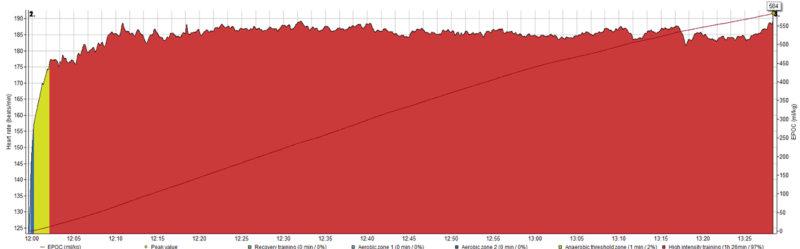
Figure 4. Heart rate and EPOC graph from a long endurance event, with high average %HRMax.
Time in the highest HR Zone has sometimes been used as a proxy for anaerobic work. However, we know the anaerobic pathways can only supply energy for a couple of minutes at a time (McArdle, Katch, & Katch, 2007) so this cannot be used as a measure of anaerobic work.
For a more in-depth look at Training Effect and how it is calculated read our White Papers: Aerobic Training Effect | Anaerobic Training Effect
Using Training Effect: Within Session Analysis
You will find that Training Effect is a very powerful tool to use during a session. It takes several complex variables and boils them down to two numbers, Aerobic and Anaerobic Training Effect. This makes it extremely easy to interpret what is happening within the session and provides you with information on two key questions:
- Are you hitting the physical targets?
- Do you need to make adjustments?
For example, if you have designed a session to work on high-intensity anaerobic activities but your athletes are presenting data that is skewed towards being aerobic you can make an adjustment to increase recovery time between reps, allowing sufficient recovery to work at the desired high intensities. Other examples include; Using TE to guide whether you have done enough on an acquisition day, or as a cap in the taper to competition to ensure your athletes don’t carry unnecessary fatigue into a game.
Training Effect also allows you to quickly identify any outliers within a group training session – something that can normally be challenging when working with groups of 20-25 athletes.
For example, you can use Training Effect to quickly identify who has found a session more challenging than expected or who has found it easier. Within seconds you are able to filter from 20-25 athletes down to two or three who may warrant further analysis.
Using Training Effect: Periodization
With team sports, in-season periodization between fixtures is key for getting athletes recovered after a game and for preparing them for the next.
Training Effect is a great metric to use when planning a training week and the numbers achieved give an idea of what you’d likely aim for within a session. One popular training model in soccer over recent years is Tactical Periodization, (Clemente, at al., 2014; Delgado-Bordonau & Mendez-Villanueva, 2014). This has a four-day build-up to a game with specific physical aims each day based upon the demands of the game.
For example, one day focuses on repeated high-intensity efforts to stress the anaerobic pathways. The next day has longer efforts with less rest to stress the aerobic pathway. You can use Training Effect to guide how strenuous each day is during the week and use the Aerobic and Anaerobic TE values to ensure you are stressing the desired energy systems within the weekly periodization model you are using.
Using the Tactical Periodization model, you might have a weekly training graph that looks something like Figure 5.
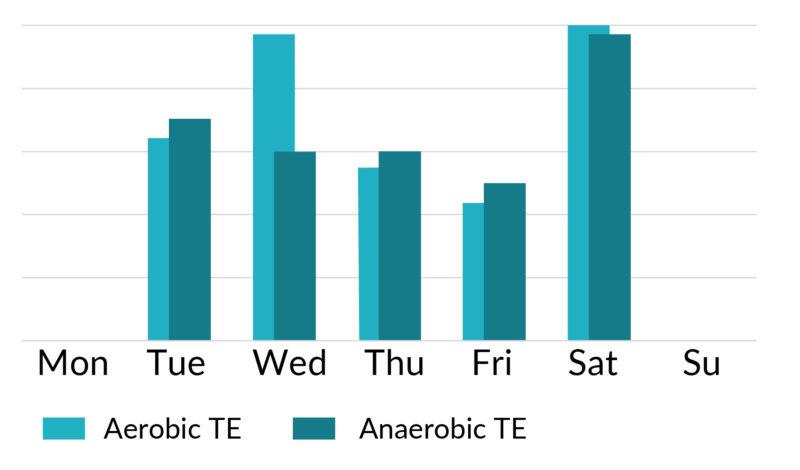
Figure 5. Hypothetical Training Effects when using a Tactical Periodisation model.
Having a periodization model like this will help guide your decision-making process within a session as described in the “Using Training Effect: Within Session Analysis” section. Having a clear picture in mind of what you want to achieve in each session, week, or month will allow you to be decisive ‘on-the-fly’ and keep your team progressing towards the physical goals you have set for them.
3. Training Impulse (TRIMP)
TRIMP is a metric that is used as a single number measure of training load.
As mentioned in the Understanding EPOC section, TRIMP will still accumulate in periods of rest. With this in mind, it is perhaps better considered as a more global measure of training load rather than just internal load because of the external time element that’s involved in the calculation.
Various methods for the calculation of TRIMP have developed since Eric Bannister’s original. Bannister’s interpretation was a calculation of time and intensity with a relative weighting so the higher %HRMax you’re working at the greater the relative contribution to the TRIMP score. See Figure 6 for a depiction, and Figure 7 for the specific calculation used in Firstbeat Sports.
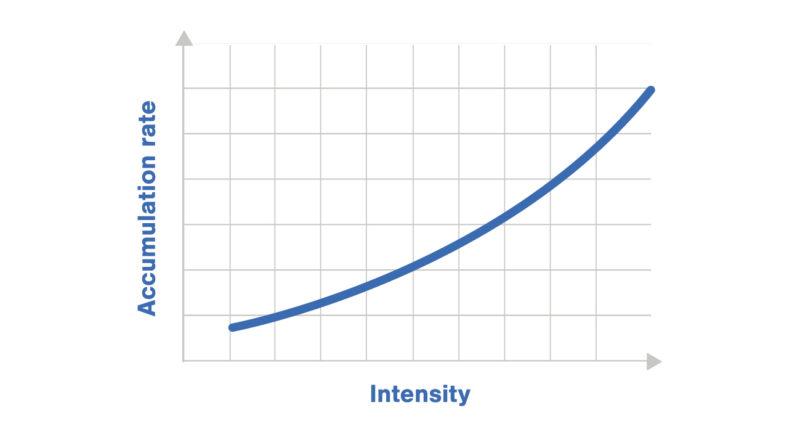
Figure 6. TRIMP accumulation rate models lactate accumulation rate increasing exponentially to intensity.
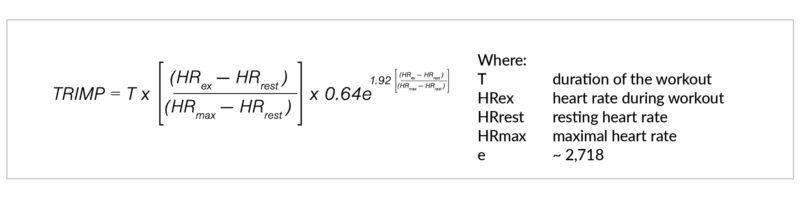
Figure 7. How TRIMP is calculated in Firstbeat Sports.
TRIMP As a Measure of Training Load
TRIMP should be used as your measure of overall training load, primarily because it includes both an internal factor (%HRMax) and an external factor (Time).
This means you get a bit of everything included within the TRIMP metric, which is what we’re looking for when seeking to quantify the total training load. Clearly, time is quite a broad variable to use when considering external load but it is still a very useful factor in this context.
One important consideration when interpreting TRIMP data is that the same score can be achieved in a variety of ways. For example, a short but very intense session with a high %HRMax could accumulate the same total TRIMP as a longer, lower intensity session. This is why using TRIMP-per-minute (TRIMP / Session Duration) is a good idea to provide some more context to the intensity of the session.
As a great measure of overall training load, TRIMP is a good basis upon which to model your Acute:Chronic Workload Ratio (ACWR). Indeed, this is the metric used within the Firstbeat Sports dashboard.
If you are not familiar with the ACWR, it is basically used as a guide to show how much training load your athletes can cope with.
Chronic Load represents an athlete’s “fitness” built up over a 28 day period, while Acute Load represents the “fatigue” from the last seven days. Generally, you will aim to keep the ACWR in the range of ~0.8-1.3 which means the fatigue of recent training does not exceed the fitness capacity the athlete has developed. This helps ensure you do not increase training loads too quickly whilst also not detraining your athletes.
As with anything, there will be exceptions to this but it’s a good guide to follow in most situations.
TRIMP As a Measure of Intensity (TRIMP/min)
Monitoring TRIMP-per-minute allows you to train as you play. This metric provides you with the information needed to replicate or exceed match intensities when desired.
As mentioned above, matching a TRIMP score along is probably not sufficient to replicate match demands as they can be accrued at varying rates. For example, a TRIMP of 100 would normally be considered ‘Moderate’ load. But if it was achieved over 90 minutes you’d have a TRIMP/min of 1.1 which is actually ‘Easy’ intensity. The same 100 TRIMP achieved over 45 minutes would be a TRIMP/min of 2.2 which is classified as ‘Hard’ intensity.
Below are the approximate definitions for ‘Easy’, ‘Moderate’ and ‘Hard’ training:
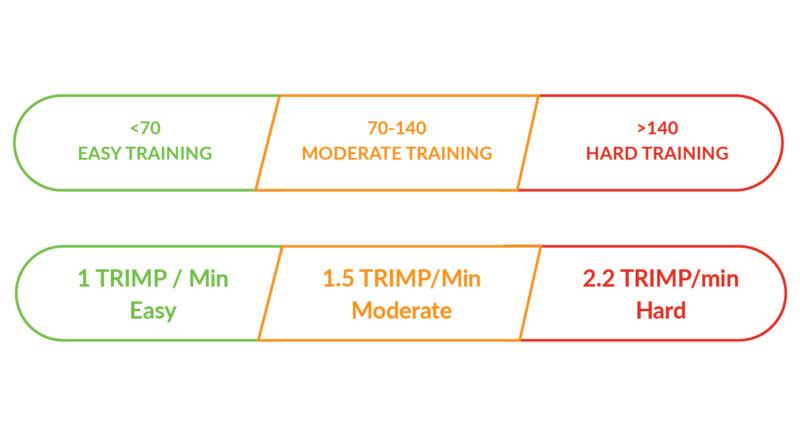
Figure 8. Guidelines for analyzing TRIMP and TRIMP/min.
You can also use this information to retrospectively assess the intensity of your training session – in its entirety or pinpointing specific drills using Firstbeat Sports’ Lap Management feature. Doing so means you can adjust what is prescribed going forward when necessary.
“When we want to reproduce the intensity and specificity of the game for a certain time during a specific drill, TRIMP/min becomes the appropriate tool for this purpose.”
– Prof. Belmar Ramos Junior
In a practical context, you may have a small-sided game (SSG) that you want to conduct at higher than game intensity to ensure athletes can cope with the ‘Worst Case Scenario’. But, after reviewing the post-session data, you see it fell short of this intensity. You might then amend the next day’s plan to feature a drill designed to achieve the intensity you were aiming for.
You don’t need to wait until after a session to analyze whether a particular part of a session was intense enough. With the live TRIMP/min reading in the Firstbeat Sports app, you can see this information in real-time. If you know what intensity you are aiming for, you can motivate the players within the session to make sure this is met. You can also make adjustments almost instantly so no training time is wasted.
The following insights show some typical game values for different team sports as well as some general guidelines. Use these to gauge the intensities and volumes that your own team is training at.
- Soccer: ~260-300 TRIMP
- Basketball: ~180-250 TRIMP
- Ice hockey: ~180 TRIMP
- Rugby: ~260-280 TRIMP
4. Training Status
Firstbeat’s unique Training Status metric takes several other variables and interprets them alongside one another in order to give you a picture of how well balanced an individual’s training has been.
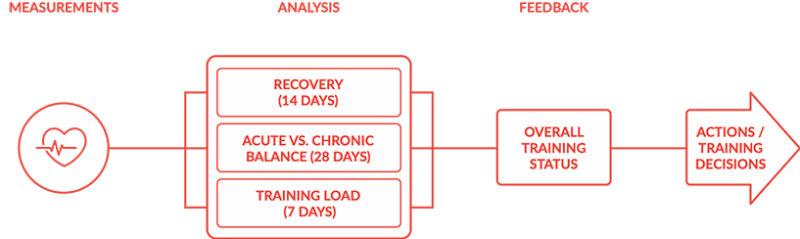
Figure 9. Training Status uses several variables to provide a holistic picture of an athlete’s training.
Training Status factors in the data from the Acute Training Load, Quick Recovery Test and Acute:Chronic Workload Ratio, providing you with a score on a 0-100 scale.
Everyone will react differently to the demands you’re placing upon them, which is why having a metric like Training Status is extremely beneficial as you can quickly see how a multitude of factors is impacting each athlete.
A score of 70+ indicates that training is well balanced. This is achieved in the following circumstances:
- There is adequate training load
- ‘Good’ training has taken place in the past and short and long-term training loads are balanced. I.e. Training load is not changing rapidly
- The body is responding well to training, indicated by effective recovery
If your athlete has a score between 30-70 this suggests they are moderately balanced while anything below 30 means they are out of balance – this could mean training load has increased too rapidly recently, or perhaps they are not recovering sufficiently. Further investigation of an athlete’s data should help you identify what is happening. Start by reviewing Acute Training Load, ACWR and QRT from the previous 14 days.
Referring to the comments dialogue within the Firstbeat Sports dashboard will give you some clues on where to start and what the issue(s) may be.
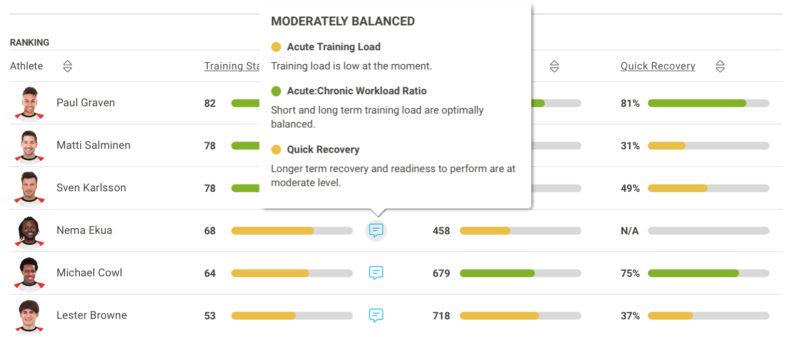
Figure 10. A practical example of Training Status.
5. Lap Management and Clipping Drills
Clipping specific drills within sessions using the Lap Management tool is an extremely useful method for keeping track of your athletes, especially if the same or similar drills are repeated often over the course of a season. Firstbeat Sports allows you to clip laps within Sports Cloud after session data has been synchronized, or in real-time using the Coach App. Please scroll down for links that show how to use these.
You can use this tool to check on an athlete’s performance within a given session in the context of the group or track the longitudinal progress of the individual.
If you are going to clip the drills from your sessions it is a good idea to create a naming protocol to make it easy to locate and compare like-for-like sessions should you ever wish to refer to historical data.
A hypothetical example is displayed below in Table 1. Using this example, you take an element from each column and combine them. For example, SSG-4v4-S.
Try to keep the naming protocol concise and while you need a degree of specificity don’t be too specific (like using precise pitch dimensions), otherwise, you could end up with a database in which nothing is repeated.
Of course, some drills like individual conditioning drills may not fit this particular format but still try to follow the same basic principle, e.g. Run-30:30-3×5-30sRest.
| A – Type of Drill | B – Number of Players | C – Pitch Size |
|---|---|---|
| Small-Sided Game (SSG) | 3 v 3 | Small (S) |
| Possession (Poss) | 4 v 4 | Medium (M) |
| Directional Possession (DPoss) | 5 v 5 | Large (M) |
| 6 v 6 | ||
| 7 v 7 |
Table 1. Example Drill Naming matrix.
Find out how to use the Lap Management Tool
Find out how to use the Real-Time Lap Management Tool
Practical Examples
Example 1
Comparing the same drill/exercise over time:
A soccer team may complete a sub-maximal run at regular intervals throughout their season as a test of a player’s conditioning. This could be a capped 30-15 Intermittent Fitness Test (Buchheit, 2008) a YoYo Test (Krustrup, et al., 2008), or a simple protocol that you devise yourself. The more relevant to your particular sport the better.
The soccer team runs their protocol so each athlete completes the same amount of external work on each occasion, and they then compare the internal responses over time.
The drill is clipped in the Firstbeat Sports dashboard, then the summary data is exported for storage in an Excel file where it’s combined with the data from each previous time the test was conducted. Here, you may choose to compare the athletes’ TRIMP or TRIMP/min in order to track their progress. An increase in their internal responses could suggest fatigue or detraining has occurred. A reduction in internal response is likely to indicate improved fitness and/or freshness.
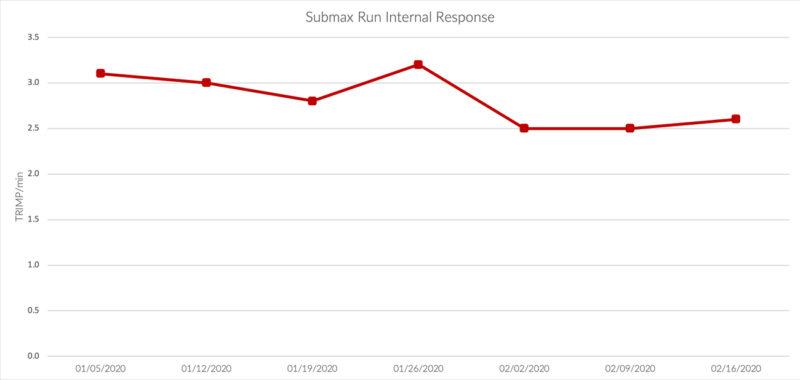
Figure 11. Submaximal Fitness Test internal responses, repeated on different dates.
A protocol like this could be run as part of your warm-up at your desired time intervals. It’s an easy and simple way to conduct some in-season testing without having to schedule a specific testing session, which relies on agreement from the head coach.
Example 2
Analyzing the impact of a specific section of practice:
You have scheduled 4 x 2-minute 5v5 small-sided games (SSG’s) within a session, and have a specific intensity you want to meet. Looking at the TRIMP/min for the whole session won’t answer whether the desired intensity was met, therefore you clip out only the periods of play that are of interest. You can then analyze the data on a group and individual level.
Perhaps some athletes were able to perform at the desired intensity for all four reps while others did not. Using this information, it is possible to implement appropriate training in the future, be it for the whole group or specific individuals.
You can also store the data for long-term analysis in the same way you have for Case 1. It is worth keeping in mind that the external demands may vary in this scenario as you cannot precisely control the work demands of an SSG in the same way you can for a fixed protocol.
Once the athletes are able to complete the 4 x 2-minute drills with a lower internal response you could increase the demands, add an extra repetition or increase the game duration to further stress the athletes and continue to develop their fitness. Verheijen (2014) provides some examples of how you may gradually increase the demands placed upon your athletes in order to overload them progressively.
Example 3
Analyzing the impact of a specific section of a game:
The final stages of a game are often when athletes are stretched to their limits. The ability to maintain physical and mental performance levels at this stage can be the difference between winning and losing.
When in-game monitoring is possible, using Lap Management allows you to isolate a critical period (e.g. the 4th quarter in basketball, or final 20 minutes of a soccer game) for review in post-analysis.
By doing so, you can easily see the physiological responses of individual players or position groups in that moment. This can aid decision-making when it comes to future tactical or substitution decisions or potentially indicates further fitness work is required. And, when comparing similar game sections over time using Data Export, you can assess whether certain players are better suited to these moments.
The below example shows lap data from an ice hockey game. Here, a ‘lap’ has been created for each period of the game. This allows coaches to analyze and compare how their athletes responded physiologically at different points of the game.
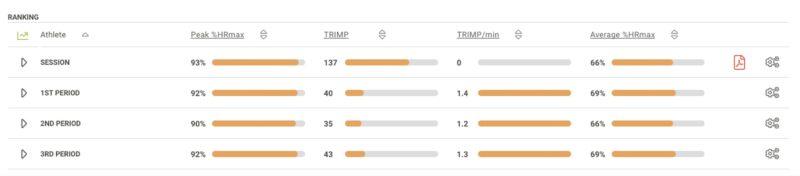
Figure 12. A comparison of intensity of periods in an Ice Hockey match.